make preferable
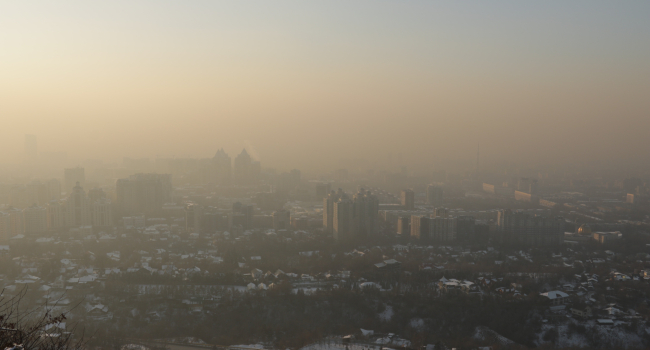
The global concentrations of one of the main air pollutants known to affect human health have been graphically illustrated for the first time by a team of scientists.
Researchers from the University of Leeds (UOL), together with colleagues from the University of Edinburgh, have created the first diagrams of air pollution around the world over the past 170 years. The study was published on the official website of the UOL.
The team created diagrams that show the atmospheric concentrations of particulate matter, or PM2.5, in the world's capitals during 1850-2021.
PM2.5 has been linked to a very wide range of health issues ranging from breathing problems like asthma, to reduced lung health, increased likelihood of developing cancer and heart disease, and an increased risk of developing many diseases including diabetes, Alzheimer’s, and Parkinson’s.
Data from computer simulations and satellite observations were combined to estimate the changing concentrations of particulate matter since the beginning of the industrial revolution
As the research showed, substantial reductions in particulate matter levels across most of Europe over the past 170 years—and predominantly Western Europe.
Also, the air in Central Asia and parts of Africa has become much dirtier due to rapid urbanization and industrialization.
The influence of natural sources was particularly notable in some locations, these sources include desert dust and wildfires.
Project stripes use an annual average to take account of the ups and downs due to changes in weather patterns throughout the year, and to make comparison between locations simpler.
However the researchers point out that even short-term exposure to very high levels can quickly have acute health effects requiring medical treatment.
According to the authors of the project, they expect that this research will help to achieve global progress in the fight for the protection of air quality and human health.